I’m excited to share my project, ESP Debug, a VSCode extension to debug ESP32 via COM ports. It’s designed to simplify the debugging process and make it more accessible for developers working with ESP32 devices.
Features:
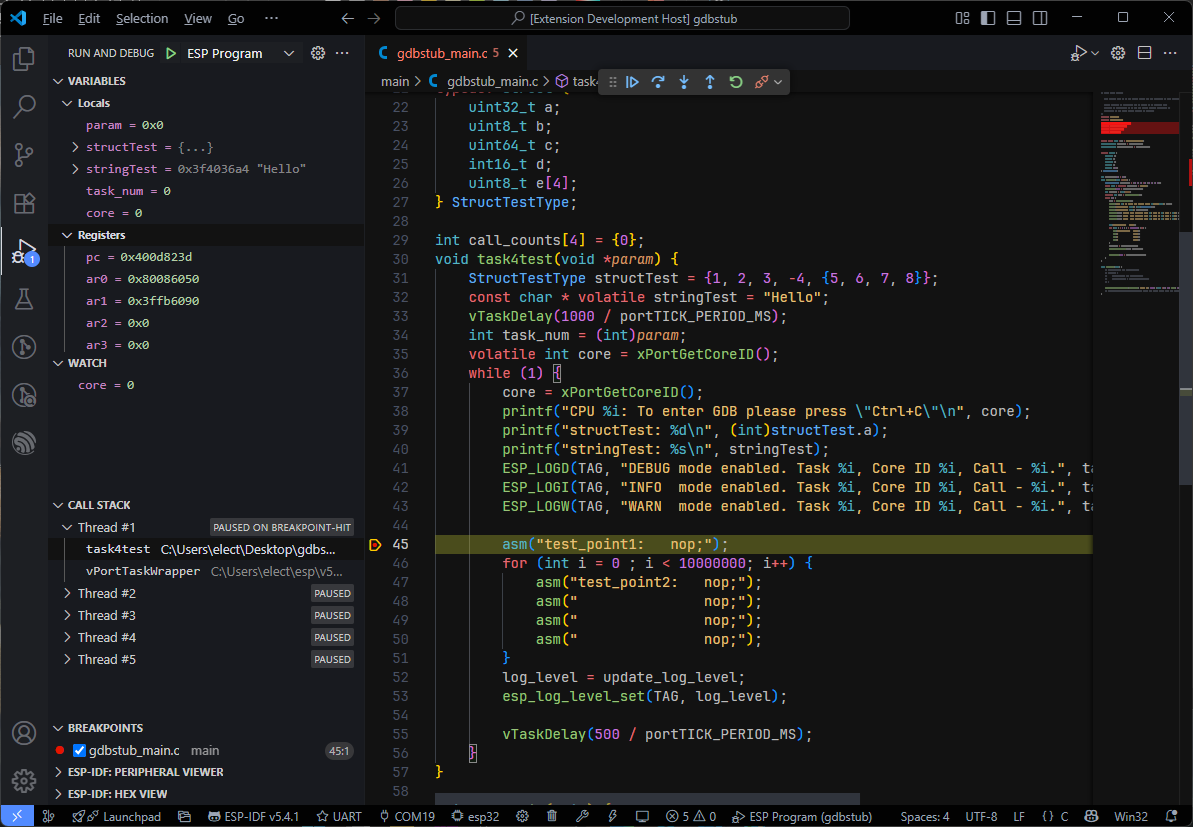
- Works with ESP-IDF's built-in GDB Stub.
- COM Port Communication: Just connect the built-in COM port on ESP32 board to debug.
- Basic debugging features:
- Pause, Continue, Stop, Restart, Step Over, Step Into, Step Out.
- Stack trace for each thread.
- Set and remove breakpoints.
- View local variables, CPU registers and evaluate expressions.
- Show messages logged from target.
- Check out the project on GitHub: ESP-Debug Repository.
- Install the extension from the VSCode marketplace: ESP-Debug Extension.
- Follow the setup guide, and start debugging your ESP32 with ease!
